
Studies with Liv.52 in the Treatment of Infective Hepatitis, Chronic Active Hepatitis and Cirrhosis of the Liver
Prof. Mandal, J.N., M.B. (Cal.), D.C.H. (Lond.), F.R.C.P. (Edin.), Professor - Director
and Roy, B.K., M.D. (Cal.), Senior House Physician to Professor-Director, Department of Medicine, Medical College and Hospital, Calcutta, India.
Liv.52 in chronic active hepatitis and cirrhosis
However, in 12 months’ time regressive changes in respect of liver cell damage were observed in 12 cases (50%) and 4 cases (50%) of the Liv.52 and Control Groups respectively.
Three cases (12.5%) of the Liv.52 Group showed no improvement of liver cell pathology, rather they became worse, in spite of intensive therapy (12 tablets of Liv.52 daily for 3 years). Two patients out of these 3 were HBsAg +ve. Four patients (50%) of the Control Group failed to improve histopathologically, ultimately attaining a picture of cirrhosis.
Thus, in 32 cases of Chronic Active Hepatitis, the above inferences have been made in respect of results of treatment (See Table XVI).
Group C: Cirrhosis of the Liver: Cases of Cirrhosis of the Liver were selected from the Medical wards of Medical College Hospital, Calcutta during the period from June 1974 to February 1975. 27 of them who could be followed up for 2-3 years were included in the present study for analysis. Nineteen patients of these 27 belonged to the study group with Liv.52, and 8 patients served as Controls. Four out of these 27 cases were chronic alcoholics for ± 20 years, and 21 had a history of recurrent (±3) jaundice, 4 out of whom were found to be HBsAg positive.
Clinical features and findings of investigations in all the cases were recorded in the proforma, as in cases of Infective Hepatitis and Chronic Active Hepatitis. B.S.P. excretion studies could be done in 10 cases only (5 Liv.52 and 5 Controls). Histopathological studies were performed in all cases and were repeated at 6 monthly intervals.
Table XVII shows the distribution of the cases age-wise and sex-wise, based on histopathological diagnosis in both Liv.52 and Control Groups.
All the 21 cases (14 on Liv.52 and 7 Controls) showing post-necrotic cirrhosis, histopathologically, had a history of recurrent jaundice. The 4 patients showing histopathological picture of portal cirrhosis had a history of consumption of alcohol in the form of country liquor over prolonged periods (±20 years).

The major symptoms and signs, number of cases involved, and their distribution, age and sex-wise in the Liv.52 and Control Groups are presented in Table XVIII.
RESULTS
Cirrhosis of Liver
1. Clinical: Clinical improvement in respect of different symptoms and signs was observed earlier in majority cases of Liv.52 Group, in comparison to that of Control Group, where the improvement was delayed, and only 50% cases showed such an improvement. The clinical improvements which were observed in different age-groups both in Liv.52 Group and Control Group have been summarised in Table XIX.
Table XIX shows that out of 19 patients in the Liv.52 Group, 4 improved clinically in 12 months’ time and another 10 in 24 months’ time.
Three cases (12.5%) of the Liv.52 Group showed no improvement of liver cell pathology, rather they became worse, in spite of intensive therapy (12 tablets of Liv.52 daily for 3 years). Two patients out of these 3 were HBsAg +ve. Four patients (50%) of the Control Group failed to improve histopathologically, ultimately attaining a picture of cirrhosis.
Thus, in 32 cases of Chronic Active Hepatitis, the above inferences have been made in respect of results of treatment (See Table XVI).
| Table XVI Results of treatment in chronic active hepatitis | |||
| Liv.52 group | Control group | ||
| (i) | Good | 9 (37.5%) | Nil (0%) |
| (ii) | Fair | 12 (50%) | 4 (50%) |
| (iii) | Poor | 3 (12.5) | 4 (50%) |
| 24 | 8 | ||
Group C: Cirrhosis of the Liver: Cases of Cirrhosis of the Liver were selected from the Medical wards of Medical College Hospital, Calcutta during the period from June 1974 to February 1975. 27 of them who could be followed up for 2-3 years were included in the present study for analysis. Nineteen patients of these 27 belonged to the study group with Liv.52, and 8 patients served as Controls. Four out of these 27 cases were chronic alcoholics for ± 20 years, and 21 had a history of recurrent (±3) jaundice, 4 out of whom were found to be HBsAg positive.
Clinical features and findings of investigations in all the cases were recorded in the proforma, as in cases of Infective Hepatitis and Chronic Active Hepatitis. B.S.P. excretion studies could be done in 10 cases only (5 Liv.52 and 5 Controls). Histopathological studies were performed in all cases and were repeated at 6 monthly intervals.
Table XVII shows the distribution of the cases age-wise and sex-wise, based on histopathological diagnosis in both Liv.52 and Control Groups.
| Table XVII: Age and sex distribution in cirrhosis cases | |||||||||||||
| Age group | Liv.52 group (19) | Control group (8) | |||||||||||
| Post-necrotic cirrhosis | Portal cirrhosis | No discernible cause | Post-necrotic cirrhosis | Portal cirrhosis | No discernible cause | ||||||||
| M | F | M | F | M | F | M | F | M | F | M | F | ||
| 10-30 years | 2 | 1 | – | – | – | – | 1 | 1 | – | – | – | – | |
| 31-45 years | 5 | 2 | 1 | – | – | – | 2 | 1 | – | – | – | – | |
| 46-50 years and above | 3 | 1 | 2 | – | 1 | 1 | 2 | – | 1 | – | – | – | |
| 10 | 4 | 3 | – | 1 | 1 | 5 | 2 | 1 | – | – | – | ||
All the 21 cases (14 on Liv.52 and 7 Controls) showing post-necrotic cirrhosis, histopathologically, had a history of recurrent jaundice. The 4 patients showing histopathological picture of portal cirrhosis had a history of consumption of alcohol in the form of country liquor over prolonged periods (±20 years).
The major symptoms and signs, number of cases involved, and their distribution, age and sex-wise in the Liv.52 and Control Groups are presented in Table XVIII.
| Table XVIII: Age/sex distribution, symptoms and signs in cirrhosis of liver | |||||||||||||||||
| Liv.52 group (19 cases) | Control group (8 cases) | ||||||||||||||||
| 10-30 years | 31-45 years | 46-60 years & above | Total | 10-30 years | 31-45 years | 46-60 years & above | Total | ||||||||||
| M | F | M | F | M | F | M | F | M | F | M | F | ||||||
| Symptoms:* | |||||||||||||||||
| Anorexia (27) | 2 | 1 | 6 | 2 | 6 | 2 | 19 | 1 | 1 | 2 | 1 | 2 | 1 | 8 | |||
| Flatulence (25) | 2 | 1 | 6 | 1 | 5 | 2 | 17 | 1 | 1 | 2 | 1 | 2 | 1 | 8 | |||
| Dyspepsia (16) | 1 | 1 | 4 | 1 | 4 | 1 | 12 | – | 1 | 1 | 1 | 1 | – | 4 | |||
| Weakness (26) | 2 | 1 | 6 | 1 | 6 | 2 | 18 | 1 | 1 | 2 | 1 | 2 | 1 | 8 | |||
| Weight loss (20) | – | 1 | 6 | – | 6 | 2 | 15 | – | – | 2 | 1 | 2 | – | 5 | |||
| Malaise (22) | 2 | 1 | 6 | 1 | 5 | 2 | 17 | 1 | 1 | 2 | – | 1 | – | 5 | |||
| Fatiguability (21) | 2 | 1 | 6 | 1 | 4 | 2 | 15 | 1 | 1 | 1 | 1 | 1 | – | 5 | |||
| Low-grade fever (10) | 1 | – | 2 | 1 | 2 | – | 6 | 1 | 1 | 1 | 1 | – | – | 4 | |||
| Bulging of abdomen (25) | 2 | 1 | 5 | 2 | 5 | 2 | 17 | 1 | 1 | 2 | 1 | 2 | 1 | 8 | |||
| Diarrhoea (6) | – | – | 1 | 1 | 1 | 1 | 4 | 1 | – | 1 | – | – | – | 2 | |||
| Yellow urine (12) | 2 | – | 2 | 1 | 2 | 1 | 8 | 1 | – | 2 | – | 1 | – | 4 | |||
| Yellow conjunctivae (12) | 2 | – | 2 | 1 | 2 | 1 | 8 | 1 | – | 2 | – | 1 | – | 4 | |||
| Haematemesis (6) | – | – | 2 | – | 2 | – | 4 | – | – | 1 | – | 1 | – | 2 | |||
| Malaena (6) | – | – | 2 | – | 2 | – | 4 | – | – | 1 | – | 1 | – | 2 | |||
| Epigastric Pain(12) | 1 | 1 | 3 | 1 | 1 | 1 | 8 | 1 | 1 | 1 | 1 | – | – | 4 | |||
| Breathlessness (2) | – | – | – | – | 1 | – | 1 | – | – | – | – | – | 1 | 1 | |||
| Signs:* | |||||||||||||||||
| Hepatomegaly (27) | 2 | 1 | 6 | 2 | 6 | 2 | 19 | 1 | 1 | 2 | 1 | 2 | 1 | 8 | |||
| Splenomegaly (27) | 2 | 1 | 6 | 2 | 6 | 2 | 19 | 1 | 1 | 2 | 1 | 2 | 1 | 8 | |||
| Ascites (23) | 1 | 1 | 5 | 2 | 4 | 2 | 15 | 1 | 1 | 2 | 1 | 2 | 1 | 8 | |||
| Oedema (23) | 1 | 1 | 5 | 2 | 4 | 2 | 15 | 1 | 1 | 2 | 1 | 2 | 1 | 8 | |||
| Wasting (22) | 1 | 1 | 4 | 2 | 4 | 2 | 14 | 1 | 1 | 2 | 1 | 2 | 1 | 8 | |||
| Clinical Jaundice (12) | 2 | – | 2 | 1 | 2 | 1 | 8 | 1 | – | 2 | – | 1 | – | 4 | |||
| Spider Argiomas (8) | 1 | – | 2 | 1 | 1 | 1 | 6 | – | – | 1 | – | 1 | – | 2 | |||
| Palmar erythema (14) | 1 | 1 | 3 | 1 | 4 | 1 | 11 | 1 | – | 1 | 1 | – | – | 3 | |||
| Gynaecomastia (4) | – | – | 1 | – | 1 | – | 2 | – | – | 1 | – | 1 | – | 2 | |||
| Testicular atrophy (3) | – | – | 1 | – | 1 | – | 2 | – | – | – | – | 1 | – | 1 | |||
| Parotid swelling (2) | – | – | 1 | – | 1 | – | 2 | – | – | – | – | – | – | – | |||
| Clubbing (1) | – | – | 1 | – | – | – | 1 | – | – | – | – | – | – | – | |||
| Purpura (1) | – | – | – | – | – | – | – | – | – | – | – | 1 | – | 1 | |||
| *Figures in parenthesis indicate number of cases. | |||||||||||||||||
RESULTS
Cirrhosis of Liver
1. Clinical: Clinical improvement in respect of different symptoms and signs was observed earlier in majority cases of Liv.52 Group, in comparison to that of Control Group, where the improvement was delayed, and only 50% cases showed such an improvement. The clinical improvements which were observed in different age-groups both in Liv.52 Group and Control Group have been summarised in Table XIX.
Table XIX shows that out of 19 patients in the Liv.52 Group, 4 improved clinically in 12 months’ time and another 10 in 24 months’ time.
| Table XIX: Clinical improvement in cirrhosis patients | ||||||||||||||||||||
| Age group | Liv.52 group (19 cases) | Control group (8 cases) | ||||||||||||||||||
| 6-9 months | 9-12 months | 12-18 months | 18-24 months | No improvement in 36 months | 6-9 months | 9-12 months | 12-18 months | 18-24 months | No improvement in 36 months | |||||||||||
| 10-30 years | 1 | – | 1 | – | 1 | – | – | – | 1 | 1 | ||||||||||
| 31-45 years | – | 2 | 2 | 3 | 1 | – | – | 1 | 1 | 1 | ||||||||||
| 45-60 years & over | – | 1 | 2 | 2 | 3 | – | – | – | 1 | 2 | ||||||||||
| 4 | 10 | 5 | – | 4 | 4 | |||||||||||||||
2. Biochemical: |
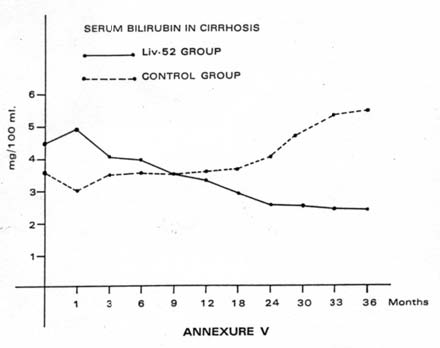 |
| Table XX: Serum bilirubin in cirrhosis of the liver (mg/100 ml) | ||||||||||||||
| On admn. | 1st month | 3rd month | 6th month | 9th month | 12th month | 15th month | 18th month | 21st month | 24th month | 27th month | 30th month | 33rd month | 36th month | |
| Liv.52 group (Mean: 19 cases) | 4.5 | 4.9 | 4.1 | 3.9 | 3.5 | 3.3 | 3.2 | 2.9 | 2.7 | 2.6 | 2.5 | 2.5 | 2.4 | 2.4 |
| Control group (Mean: 8 cases) | 3.6 | 3.5 | 3.5 | 3.6 | 3.6 | 3.6 | 3.7 | 3.7 | 4.0 | 4.1 | 4.4 | 4.7 | 5.3 | 5.4 |
| (ii) Alkaline Phosphatase: (1) In 4 cases on Liv.52, values of Alkaline phosphatase showed early improvement which became normal in 9 to 12 months; whereas no case in the Control Group showed a similar improvement during the same period. (2) In 10 cases on Liv.52, Serum Alkaline phosphatase showed moderate initial improvement, the values becoming normal within 18 to 24 months, and remaining normal for the next 12 months of observation, as against only 3 cases of Control Group showing only slight improvement in 24 months’ time. (3) Five patients on Liv.52, 5 of the Control Group failed to show any improvement in the Alkaline phosphatase level, even in 36 months. | 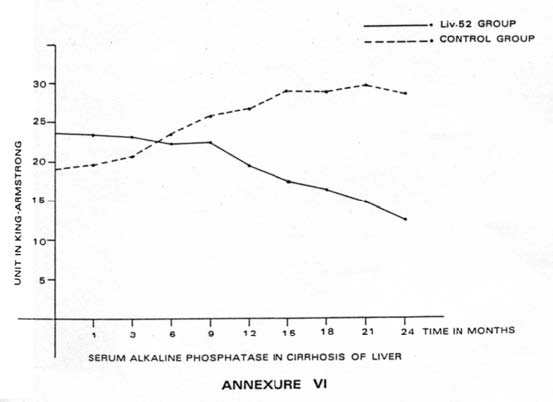 |
| Table XXI: Alkaline phosphatase in Cirrhosis of liver (in K.A. units) | ||||||||||
| On admn. | 1st month | 3rd month | 6th month | 9th month | 12th month | 15th month | 18th month | 21st month | 24th month | |
| Liv.52 group (Mean: 19 cases) | 23.8 | 23.2 | 23.1 | 22.07 | 20.4 | 19.4 | 17.3 | 16.2 | 14.6 | 12.6 |
| Control group (Mean: 8 cases) | 19.0 | 19.8 | 21.5 | 23.3 | 25.6 | 26.3 | 28.7 | 28.7 | 29.3 | 28.4 |
(iii) Serum Albumin: Majority of the patients on Liv.52 showed significant improvement of hypoalbuminaemia, which was a marked feature in all cases of cirrhosis. (1) In four (4/19) cases on Liv.52, the Serum albumin values became normal in 12 months’ time, as against none in the Control Group. (2) In ten (10/19) patients on Liv.52, Serum albumin values attained normal levels in 18 to 24 months’ time, as against 3 out of 8 of the Control Group showing similar result during the same period. (3) Five patients on Liv.52 and 5 patients of the Control Group failed to show any improvement in their albumin level, even after 36 months, rather some of the Control Group showed deterioration.
(iv) Serum Globulin: Hyperglobulinaemia was a common feature in almost all cases of cirrhosis liver in the series. (1) In four cases on Liv.52, Serum globulin levels became normal in 12 months’ time, as against none in the Control Group. (2) In 10 cases on Liv.52, Serum globulin level attained normal level in 18 to 24 months, as against 3 patients of Control Group who showed a slight improvement during the same period. (3) Five cases on Liv.52 (5/19) and 5 cases of Control Group (5/8) failed to show any improvement in their Serum globulin level, even in 36 months.
Copyrights © 2009 healthyliver.co.uk